In today’s data-driven landscape, businesses seek tools to turn raw information into actionable insights. As organizations grow, having a reliable business intelligence platform becomes crucial for informed decision-making.
1. Microsoft Power BI
Microsoft Power BI is a standout tool in self-service business intelligence. It features an intuitive interface for effortless data visualization and integrates with various data sources. Power BI generates clear visualizations that transform complex data into actionable insights. With a free version available, it caters to both individuals and organizations.
Designed for user-friendliness, Power BI allows non-technical users to create sophisticated reports and dashboards quickly. It offers scalability and cost-effective solutions for startups and large enterprises alike, making it a reliable choice for those exploring self-service BI.
Key features include:
- Extremely powerful platform with a wealth of data source connectors
- Very user-friendly interface
- Exceptional data visualization capabilities
- Desktop and web versions available
However, it’s worth noting that the refresh cycle is limited on the free version.

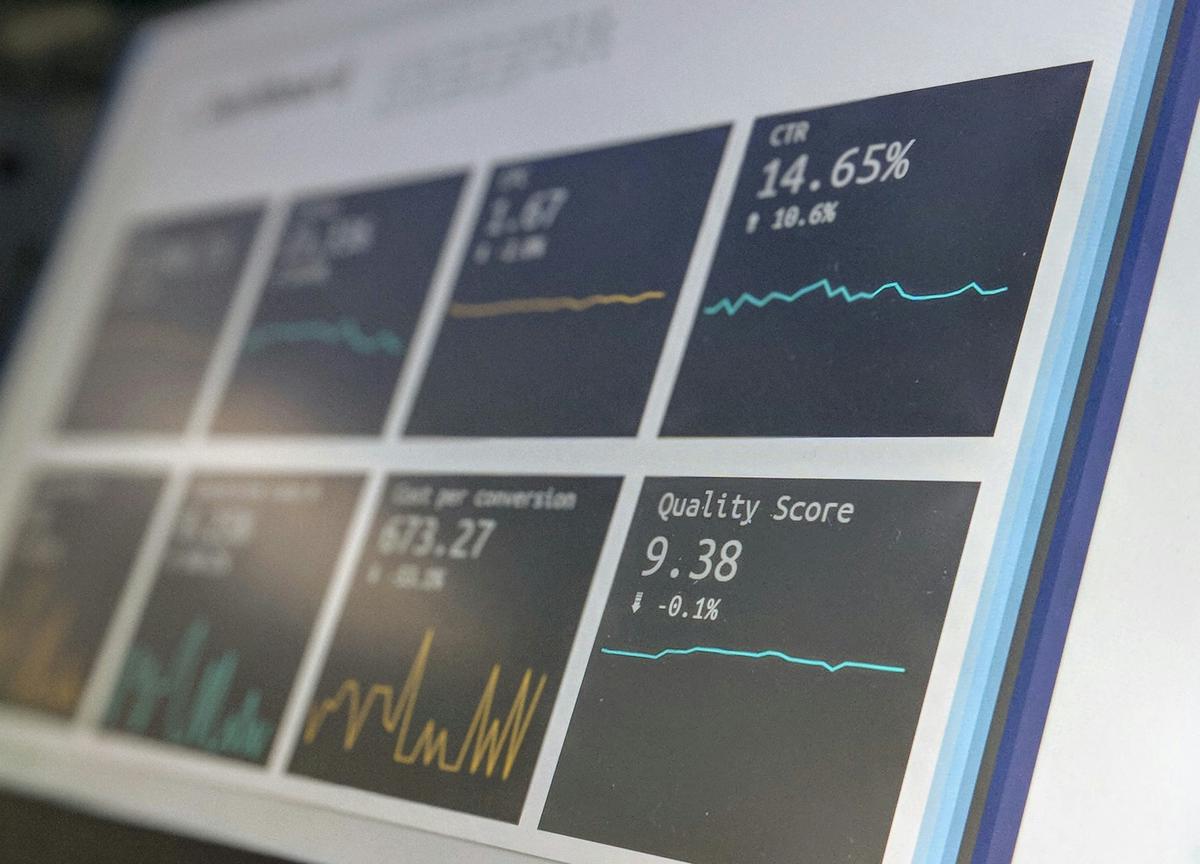
Photo by dawson2406 on Unsplash
2. Tableau
Tableau is known for its exceptional data visualization capabilities. It offers a drag-and-drop interface, making it easy for users to generate interactive visuals without deep technical expertise. The “Ask Data” functionality allows users to interact with data conversationally, empowering both novices and seasoned analysts to unlock insights through natural language queries.
Tableau integrates with various data sources, including spreadsheets, cloud services, and SQL-based databases. It can perform cross-database joins, offering a consolidated view of disparate data sets. The platform excels in diverse visualization options, contributing to rich data storytelling that helps teams understand business dynamics at a glance.
While mastering Tableau may require some training, its active community and wealth of resources make the learning curve manageable. It provides a powerful platform for discovering patterns and making informed decisions, suitable for both experienced analysts and those new to analytics.
Key strengths:
- Enormous collection of data connectors and visualizations
- User-friendly design
- Impressive processing engine
- Mature product with a large community of users
Note: Full mastery of the platform requires substantial training.
3. Sisense
Sisense is recognized for its innovative approach to data analytics and integration, particularly in complex data environments. It features natural language querying, allowing non-technical users to pose queries in plain English and receive detailed insights without extensive coding knowledge.
The platform’s in-chip processing technology enhances analytical speed and efficiency by processing data directly within CPU caches, reducing strain on system resources and enabling faster computation. Sisense’s architecture is built for scalability, supporting dynamic business growth and evolving data management needs.
Sisense presents data through customizable, interactive dashboards, enabling teams to craft compelling visual representations of data-driven insights. Its API-driven design facilitates easy integration with existing systems, providing a cohesive analytics ecosystem without disruptive overhauls.
Notable features:
- Solid natural language query in third-party applications
- In-chip processing resolves bottlenecks
- Powerful analytics process
Potential drawbacks:
- Perhaps a bit complex for a self-service BI tool
- Natural language features have limitations
4. Looker
Looker is a cloud-based platform with extensive data integration capabilities. It features an intuitive web interface that allows non-technical users to build and customize reports easily. Looker promotes team collaboration, enabling users across the organization to explore and share insights.
The platform connects directly to databases, enabling live data exploration rather than relying on static reports. This real-time access allows teams to make informed decisions based on current information. Looker’s embedded analytics feature allows businesses to integrate data insights into existing applications and workflows.
Looker offers a variety of visualization tools to transform raw data into clear insights. It supports a wide range of visual representation options adapted to specific needs, whether for simple dashboards or complex analytics models.
“Looker is designed to help you capture and analyze data from various sources to make smarter business decisions. You can analyze supply chains, digital marketing efforts, customer behavior, and customer value across multiple channels and drill into the sources that interest you.”
5. Qlik Sense
Qlik Sense is designed to empower users with intuitive visualizations and AI-driven analytics. Its user-friendly interface caters to individuals across a spectrum of technical expertise. The platform leverages artificial intelligence to enhance decision-making, providing search-based analytics for innovative data interaction.
Qlik Sense creates intelligent, interactive visualizations that bring data to life. Users can build custom dashboards that visualize data trends and prompt insightful discussions. The AI feature guides users in uncovering unexpected patterns and relationships within their data.
The platform integrates with various data sources, enabling comprehensive analysis across diverse datasets. Its associative engine uncovers hidden connections within the data, providing a holistic view of operations. Qlik Sense also offers embedded analytics capabilities, integrating insights into existing business applications and processes.
6. Google Data Studio
Google Data Studio is a free tool offering accessible data visualization solutions. It integrates seamlessly with Google Analytics and other Google products, making it attractive for teams already using the Google ecosystem.
The platform features a user-friendly interface that simplifies data analytics. Users can create and share professional-grade reports and dashboards with minimal technical expertise. Google Data Studio supports various data sources, including third-party systems, ensuring comprehensive data integration.
The tool excels in customization, offering a wide range of templates and visualization options. Users can adjust reports to fit specific business needs, transforming raw data into engaging visual representations. Google Data Studio’s collaborative nature promotes teamwork, as reports and dashboards can be easily shared among stakeholders.
Key advantages:
- Free to use
- Exceptional platform for website and mobile app analytics
- Wide range of customization options
Potential limitations:
- Customer support has too much automation
- Focus on marketing and advertising can be frustrating to some users
- Relies mostly on third parties for training
7. Zoho Analytics
Zoho Analytics combines affordability and functionality, catering well to small and medium-sized enterprises. It offers comprehensive features at an accessible price point and integrates smoothly with other Zoho apps.
The platform provides advanced data visualization capabilities, allowing users to transform raw data into insightful visual representations. Its drag-and-drop interface simplifies the process of creating and customizing reports and dashboards.
Zoho Analytics integrates with various external data sources, both cloud-based and on-premise. This versatility allows businesses to consolidate their data across platforms, resulting in a unified view of operational metrics. The tool also promotes collaboration, enabling teams to share insights and reports easily.
| Pros | Cons |
|---|---|
|
|

8. ThoughtSpot
ThoughtSpot offers a user-friendly interface designed for non-technical users seeking immediate insights. Its search-based analytics allows users to interact with data through natural language queries, simplifying data exploration.
The platform organizes data intuitively, enabling users to conduct analyses without complex configurations. ThoughtSpot automatically generates visualizations, helping users quickly grasp the significance of their data. It integrates with various data sources, providing a comprehensive view for strategic decision-making.
ThoughtSpot supports collaboration by allowing users to share insights across teams easily. This feature helps break down silos and ensures that valuable insights are acted upon swiftly and effectively.
Key benefits:
- Simple user interface
- Fit for non-technical users
- Easy integrations
Potential drawbacks:
- Poor engineering layer
- Doesn’t integrate with NoSQL data sources
- Users cannot create custom visualizations
9. SAP Analytics Cloud
SAP Analytics Cloud is a robust self-service business intelligence tool, particularly suited for enterprises requiring real-time analytics and IoT data streaming capabilities. It excels at converting complex data into compelling visualizations, providing decision-makers with dynamic, data-driven insights for strategic planning and execution.
Key features of SAP Analytics Cloud include:
- Real-time insights: The platform operates at business speed, crucial for organizations needing to respond quickly to market changes and operational shifts.
- IoT data streaming: Monitors and analyzes connected device performance, offering visibility into operations and enabling proactive problem-solving.
- Data visualization: Versatile storytelling tools allow users to create interactive and engaging presentations, making complex data easier to understand.
- Integration: Connects smoothly with other SAP applications and external systems, ensuring consistent data flows across the business ecosystem.
- Collaboration: Allows teams to share insights and work together on analyses, breaking down silos and encouraging cross-functional teamwork.
SAP Analytics Cloud is valuable for organizations aiming to maximize their data’s potential through real-time analytics and IoT integration. It equips businesses with the tools necessary to transform data into strategic assets, supporting both operational efficiency and market agility.
10. Knowi
Knowi is a self-service business intelligence tool that combines natural language capabilities with versatile visualization options. Designed for non-technical users, it allows individuals across various departments to explore data and generate insights without requiring extensive analytical expertise.
Key features of Knowi include:
- Natural Language Processing (NLP): Users can interact with data using plain English queries, making complex datasets accessible to those without SQL expertise.
- Diverse visualization options: Offers various chart types and customization options to present data effectively for different analytical needs.
- User-friendly interface: Simplifies the process of building, customizing, and sharing visualizations.
- Data integration: Able to join data from multiple sources, providing a comprehensive view of operations.
- Embedded analytics: Supports integration of analytics into existing applications, ensuring critical information is accessible when and where needed.
Knowi bridges the gap between data complexity and usability, promoting data literacy across organizations. It empowers both experienced data scientists and those new to data exploration to transform data into actionable insights.

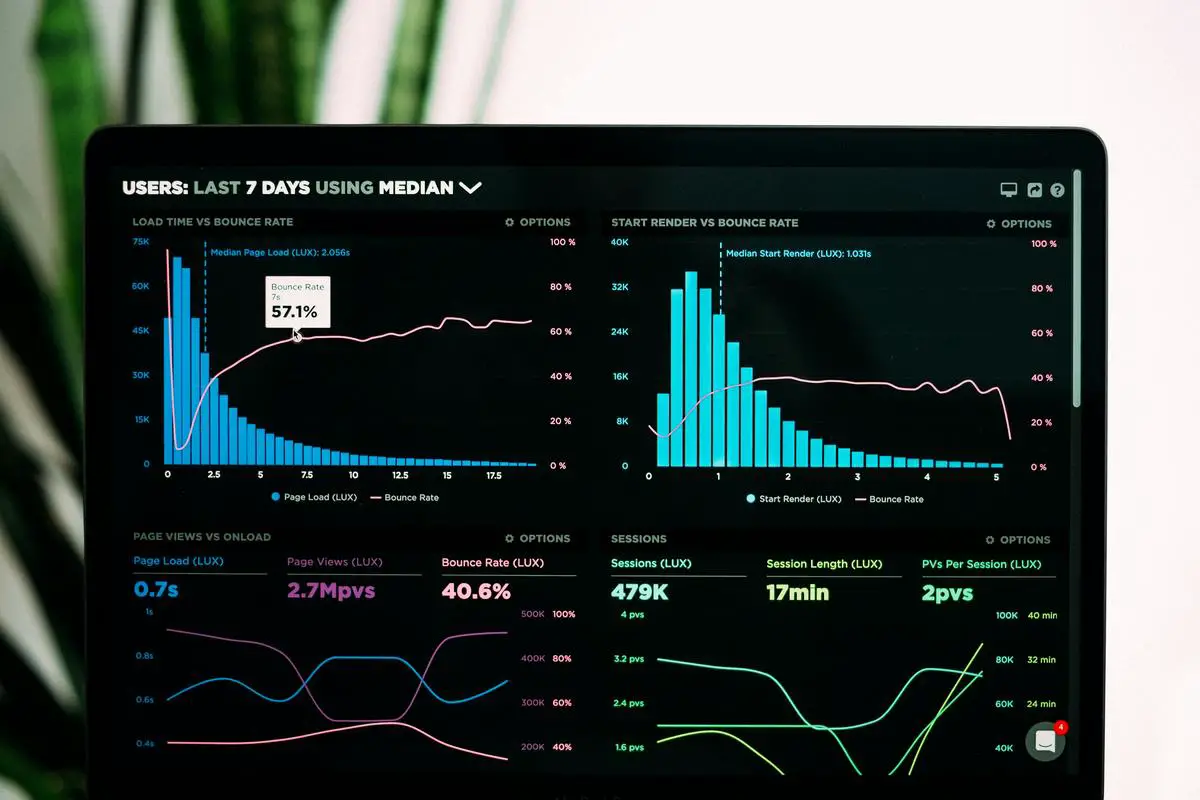
Photo by lukechesser on Unsplash
Selecting the right business intelligence tool can significantly impact how effectively an organization utilizes its data. By choosing a platform that aligns with your needs, you empower your team to transform complex datasets into clear and impactful insights.


